
Possible breach of support level by Tesla Inc.
Tesla Inc. is moving towards a support line which it has tested numerous times in the past. We have seen it retrace from this line before, so at this stage it isn’t clear whether it will breach this line or rebound as it did before. If Tesla Inc. continues in its current trajectory, we could […]
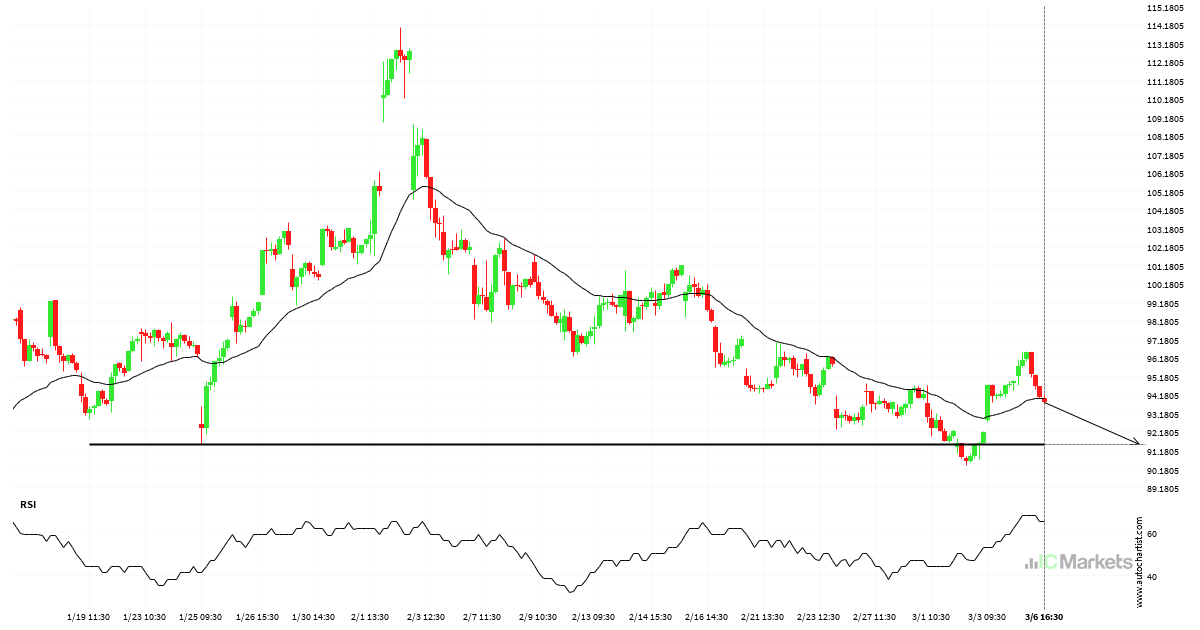
Amazon.Com Inc. – getting close to psychological price line
Amazon.Com Inc. is moving towards a support line. Because we have seen it retrace from this level in the past, we could see either a break through this line, or a rebound back to current levels. It has touched this line numerous times in the last 47 days and may test it again within the […]

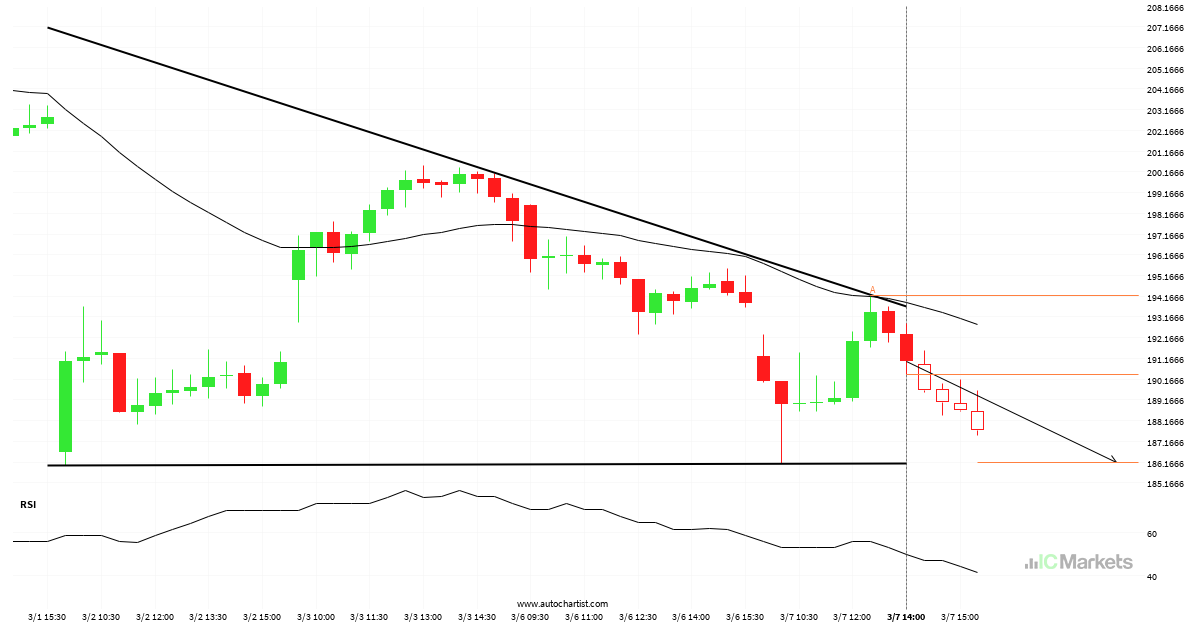
Biogen Idec Inc approaching support of a Cunha descendente
Biogen Idec Inc is approaching the support line of a Cunha descendente. It has touched this line numerous times in the last 56 days. If it tests this line again, it should do so in the next 3 days.
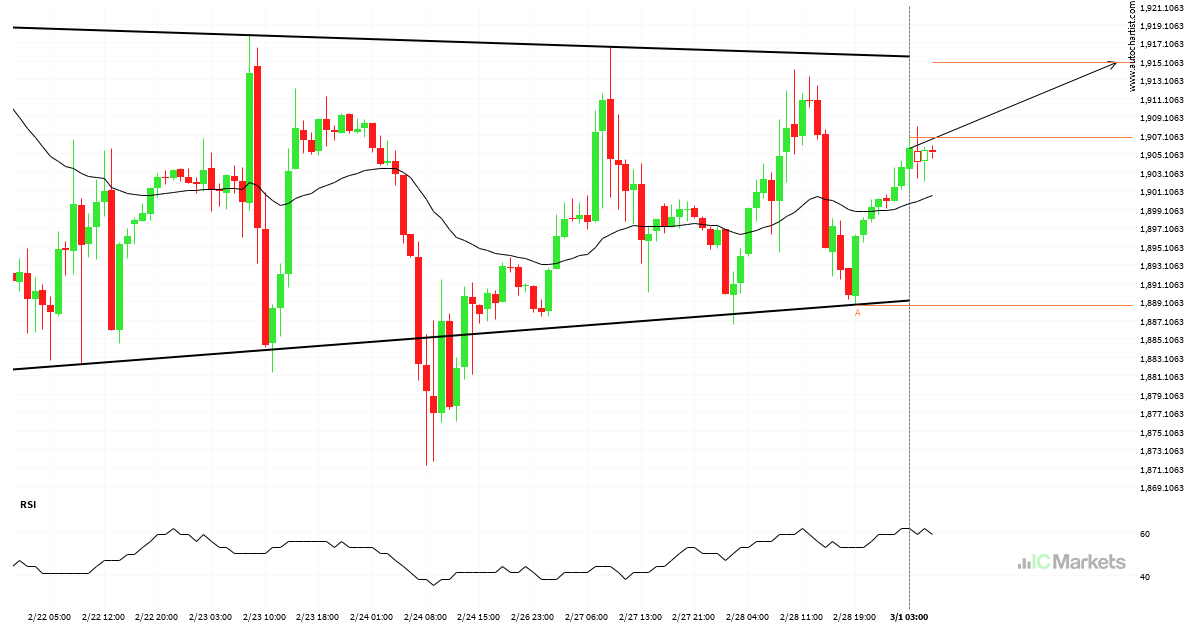
Possible breach of resistance level by US Small Cap 2000 Index
US Small Cap 2000 Index is moving towards a resistance line which it has tested numerous times in the past. We have seen it retrace from this line before, so at this stage it isn’t clear whether it will breach this line or rebound as it did before. If US Small Cap 2000 Index continues […]
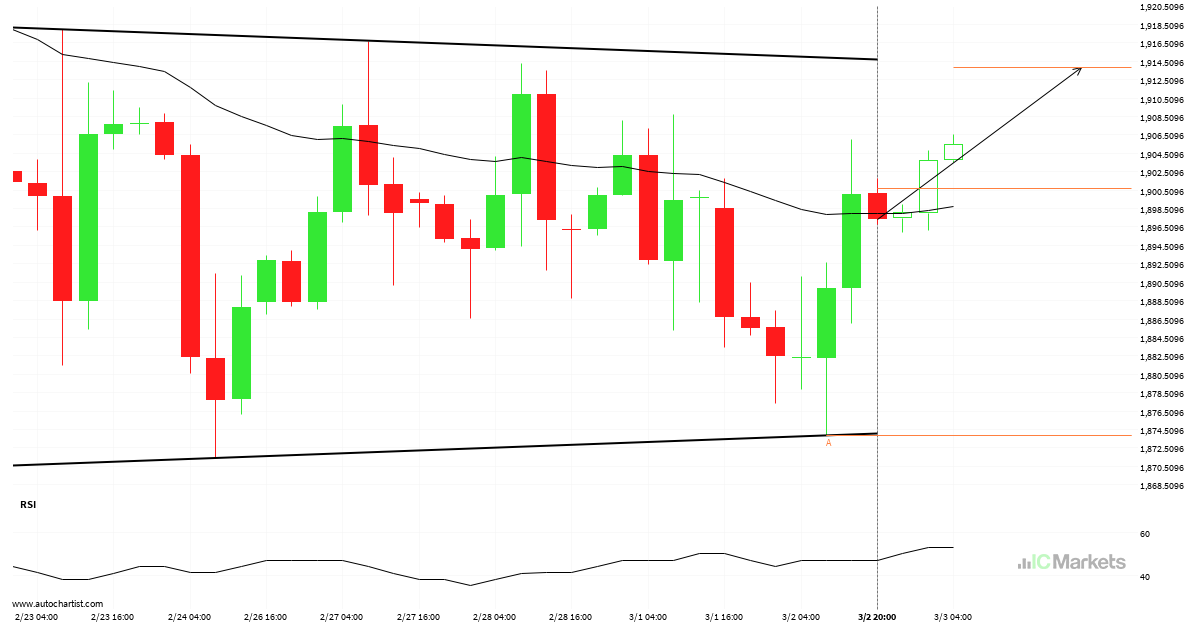
Either a rebound or a breakout imminent on US Small Cap 2000 Index
US Small Cap 2000 Index is heading towards the resistance line of a Cabeça e Ombros Inverso. If this movement continues, the price of US Small Cap 2000 Index could test 1914.9728 within the next 2 days. It has tested this line numerous times in the past, so this movement could be short-lived and end […]
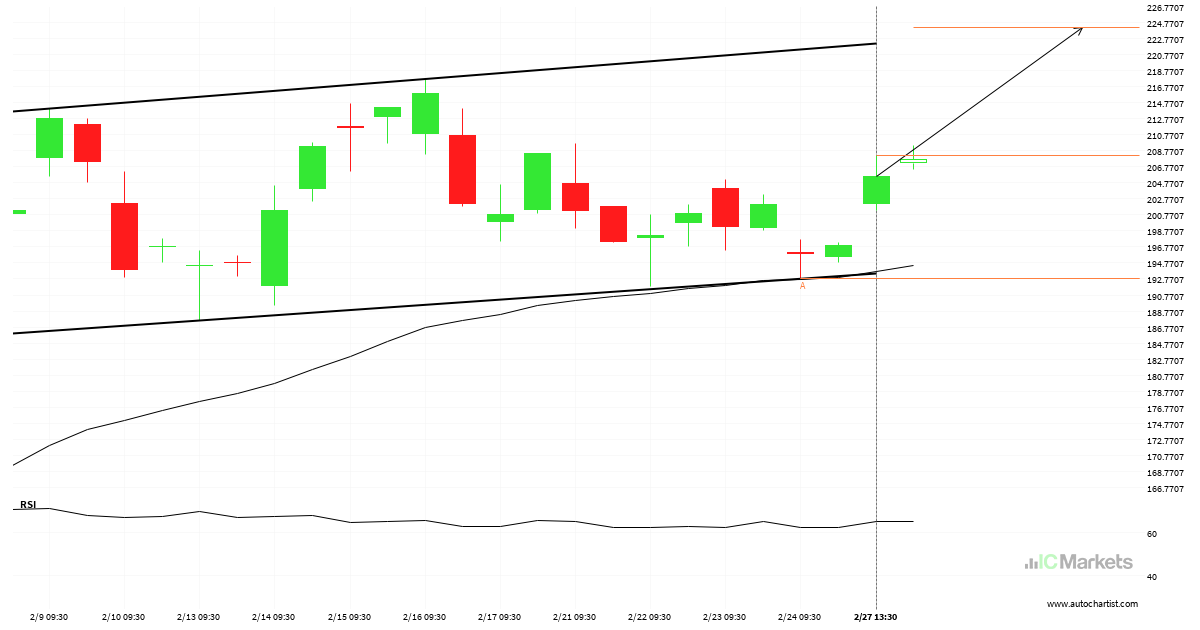
Either a rebound or a breakout imminent on Tesla Inc.
Tesla Inc. is heading towards the resistance line of a Bandeira. If this movement continues, the price of Tesla Inc. could test 224.0475 within the next 23 hours. It has tested this line numerous times in the past, so this movement could be short-lived and end up rebounding just like it did in the past.
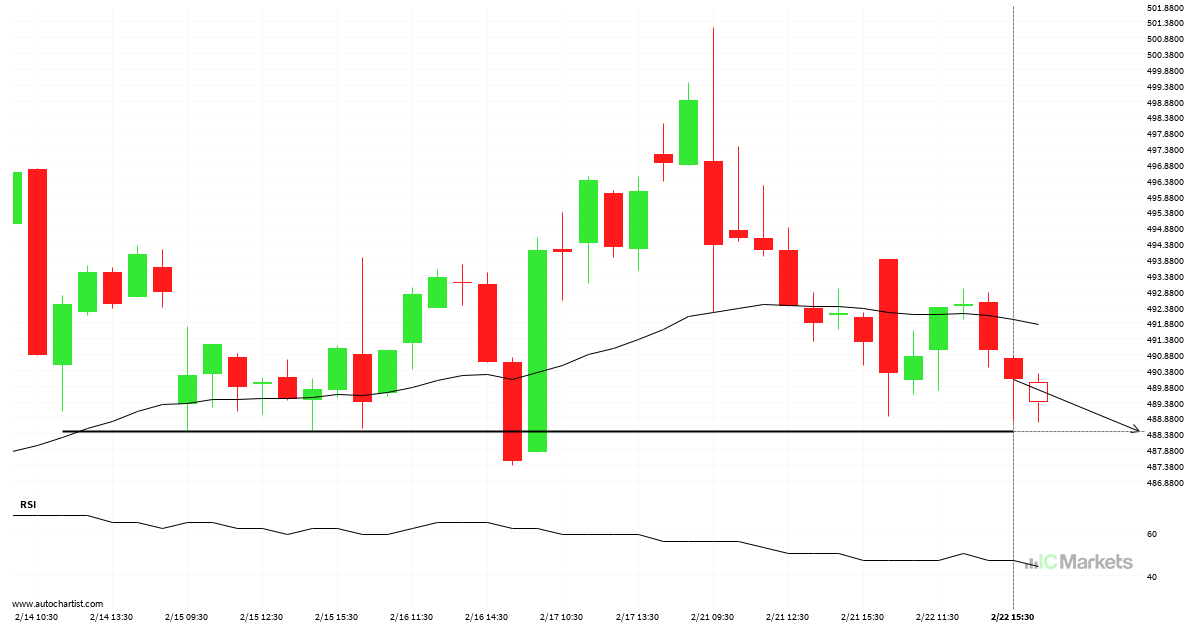
Either a rebound or a breakout imminent on Unitedhealth Group Inc.
Unitedhealth Group Inc. is heading towards a line of 488.4400. If this movement continues, the price of Unitedhealth Group Inc. could test 488.4400 within the next 8 hours. But don’t be so quick to trade, it has tested this line numerous times in the past, so this movement could be short-lived and end up rebounding.

A final push possible on Unitedhealth Group Inc.
Unitedhealth Group Inc. is heading towards 485.7150 and could reach this point within the next 2 days. It has tested this line numerous times in the past, and this time could be no different, ending in a rebound instead of a breakout. If the breakout doesn’t happen, we could see a retracement back down to […]
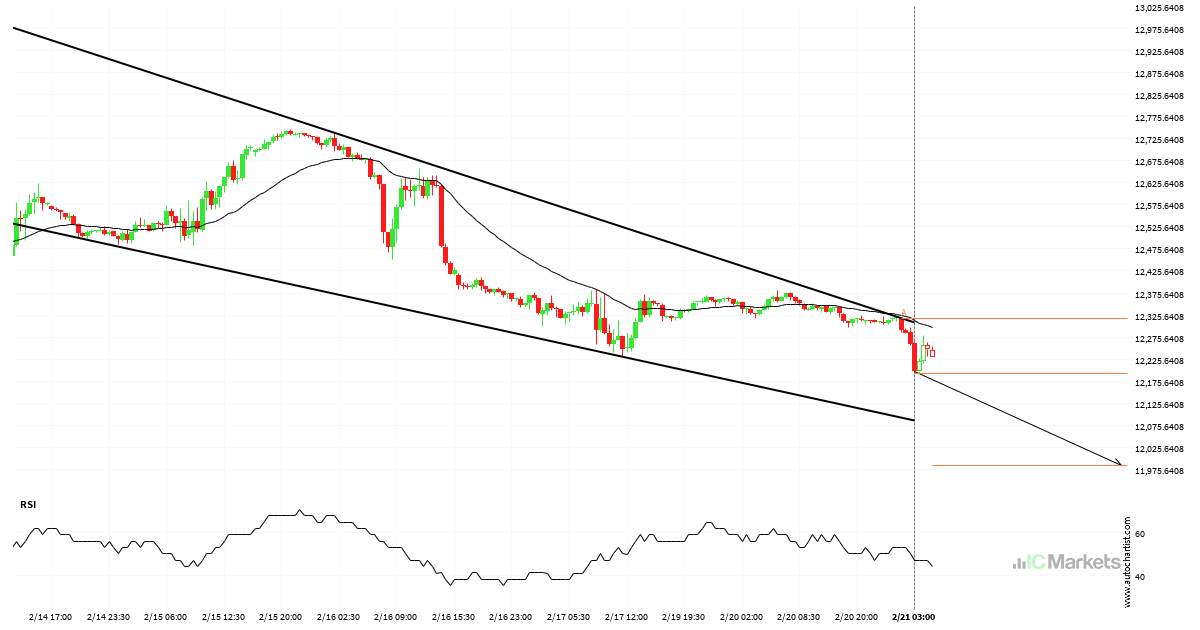
Either a rebound or a breakout imminent on US Tech 100 Index
US Tech 100 Index is heading towards the support line of a Cunha descendente. If this movement continues, the price of US Tech 100 Index could test 11985.9727 within the next 2 days. It has tested this line numerous times in the past, so this movement could be short-lived and end up rebounding just like […]
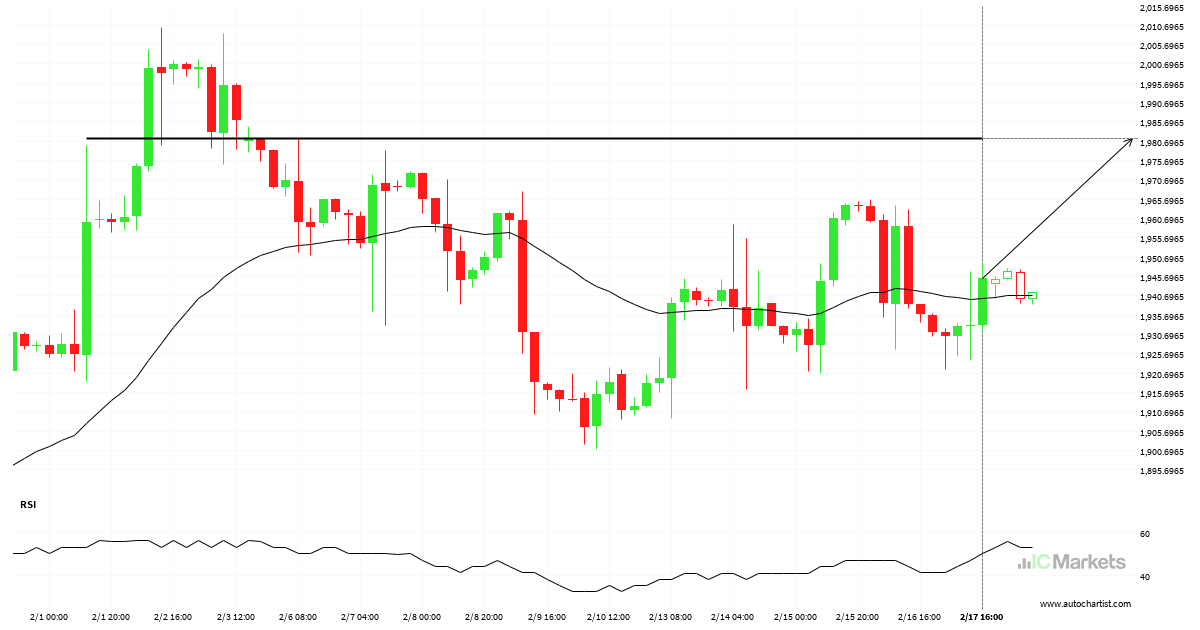
Either a rebound or a breakout imminent on US Small Cap 2000 Index
US Small Cap 2000 Index is heading towards a line of 1981.4900. If this movement continues, the price of US Small Cap 2000 Index could test 1981.4900 within the next 7 hours. But don’t be so quick to trade, it has tested this line numerous times in the past, so this movement could be short-lived […]